A product of ours had a serious problem. We could reproduce it by running the main application for several hours, the result of which was that a back-end service was crashing. Initial investigation showed that there was excessive memory usage. Leaks were hunted and we tried to patch and improve all possible situations that may result in leaks.
This isn’t as simple as I make it sounds. There are many cases with exceptions being throws from the network layer and these exceptions bring the whole stack undone. Sure we’re using smart pointers all over, but still, there are some tricky situations with cached objects, COM, network buffers and whatnot.
Memory leaks aside, I noticed something more disturbing: Handle leaks. Memory leaks would affect the ill application, but the system is more or less immune until the culprit crashes in heaps of smoke. But if you have kernel handles leaking, then you are bound to have an unstable system. This is the type of leak that one must resolve ASAP. Apparently, we were leaking kernel handles at an alarming rate.

Third Party?
An immediate suspect is a 3rd party library we were using to handle some MAPI chores. Could that be the source of the leaks? Sure it’s an easy call, but without the right research it’s no use. Plus, replacing that library is not trivial. And who’s to say we’d do a better job rewriting it ourselves? If leaks are such a hard issue to notice and fix, who’s to say we won’t have a bunch more ourselves? After all, rewriting the library functions means we have to rewrite both the good and the bad ones. There is no marker to hint us where the leak is either. So really, we aren’t better off rewriting anything ourselves.
In addition, it’s not very difficult to proof whether or not the said library is to blame. Some investigation was warranted. First thing was to get some stack traces on the leaks. With the stack trace we can tell where the leaked object construction was coming from. This can be done using windbg, the great debugger. Windbg has a handle tracing extension called htrace. After loading our service, run as a console for simplicity, I hit “!htrace -enable” in windbg. “g” to run the application. I run it through a cycle of data processing to let it do it’s necessary allocations and settle. Back in windbg, Break. Now we can set a marker to track the handles “!htrace -snapshot” then “g” again to run it back. Another cycle of data processing and we break it again in windbg. Time to collect the data with “!htrace -diff”.

Sure enough I got a rather long list of leaked objects. Copied the list into my favorite text editor for eyeballing. Looks like a bunch of them were duplicates. I looked very carefully to where the handles were allocated, I was looking for evidence that the 3rd party library was allocating, and hence leaking, them. Well, turns out that there was very little reason to think that the leaks were from the unnamed 3rd party library, and every reason to suspect MAPI was the culprit. These lines sort of gave it away:
0x7c80ea2b: kernel32!CreateMutexA+0x00000065
0x35f7452f: MSMAPI32!SzGPrev+0x00000293
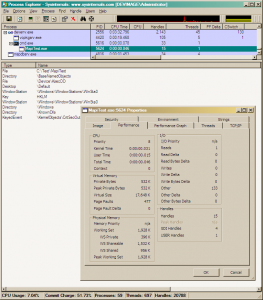
Ok, so we suspect MAPI32 to be the source, now what? We need to prove it. But before that, let’s examine the leaks. Procexp, the great task manager replacement by Russinovich, would be all we need. I fired it up and run the application again. In procexp I noticed the number of handles before and after each cycle. Sure enough the number was growing. In procexp one can see new items and deleted items in (the default) green and red colors. This is called highlight. The duration for highlight difference is set to 2 seconds by default. I maxed the duration to 9 seconds to give me enough time to pause procexp and prevent it from updating the data. The space bar is the shortcut to pause/resume refreshing.

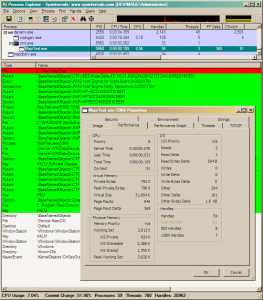
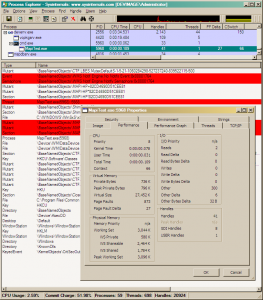
Ready. Now we need to select the application from the processes list and bring up the handle view. Here we see all the handles allocated by the application. Anything new will show in green anything deleted in red. Right now we’re interested in the green stuff that never go away (even though the color will revert to the default after 9 seconds).
I run another data cycle and sure enough a bunch of reds and greens showed up. Sure enough a few of them remained. 3 to be exact. Looking at the type, they were “Mutant”, “Mutant” and “Section”. Obscure? Not really. Mutant is the internal name for Mutex and a Section is a memory block backed with a file, most probably a mapped file view.
These aren’t exactly light-weight objects to leak.
But our work isn’t over yet. We need to figure out a workaround. Let’s fire up visual studio to type some code. What we need to do is to simulate the execution of the key MAPI functions that we know the intermediate library must execute to carry out the operations we ask it to perform. To make things easy for me, I assigned a number to each operation, such that on the console I could hit a number and get an operation executed. I added both the operation and cleanup as separate commands. Here is some code.
int _tmain(int argc, _TCHAR* argv[])
{
	HRESULT hr;

	int count = 1;
	while (true)
	{
		char c = getch();

		switch (c)
		{
			case '0':
			{
				std::cout << "Calling MAPIUninitialize." << std::endl;
				::MAPIUninitialize();
			}
			break;

			case '1':
			{
				std::cout << "Calling MAPIInitialize." << std::endl;
				MAPIINIT_0 mapiinit= { MAPI_INIT_VERSION, MAPI_NT_SERVICE | MAPI_MULTITHREAD_NOTIFICATIONS };
				hr = ::MAPIInitialize(mapiinit);
			}
			break;

			case '2':
			{
				std::cout << "Calling MAPILogonEx." << std::endl;
				LPMAPISESSION lpMAPISession = NULL;

				ULONG ulFlags = MAPI_NO_MAIL |
								MAPI_NEW_SESSION |
								MAPI_EXPLICIT_PROFILE |
								MAPI_EXTENDED |
								//MAPI_NT_SERVICE |
								MAPI_LOGON_UI;

				hr = ::MAPILogonEx(0,
					  NULL,//profile name
					  NULL,//password - This parameter should ALWAYS be NULL
					  ulFlags,
					  &lpMAPISession);//handle of session
				if (FAILED(hr))
				{
					std::cout << "Failed to logon " << hr << std::endl;
				}

				UlRelease(lpMAPISession);
			}
			break;
		}
	}

	::CoUninitialize();
	return 0;
}

I omitted the other cases, since it’s redundant. You get the idea. Basically, after adding about 10 cases, I started playing around with the different commands to simulate a run of our application. Procexp was monitoring the number of handles and I was hitting on the num-pad to simulate the application. Soon I noticed a trend, and a trend I was looking for. Turns out MAPIInitialize was allocating a lot of handles and MAPIUninitialize wasn’t releasing all of them.
Lo and behold, turns out they are 3 handles and of the same type as I traced in the application!
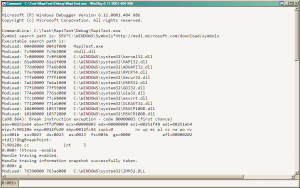
Now that we strongly suspect MAPIInitialize to be the source of the leak, let’s put the final nail in the proof’s proverbial coffin. Of course, using windbg. Back to windbg, this time let’s load the test application which helped us suspect MAPIInitialize in the first place. Same drill. Enable htrace, run the application, call MAPIInitialize by hitting ‘1’, call MAPIUninitialize by hitting ‘0’, break in windbg, take a snapshot, run the application, hit ‘1’ then ‘0’ again, break in windbg and finally get a diff from the snapshot. Here is the full run:
Microsoft (R) Windows Debugger Version 6.11.0001.404 X86
Copyright (c) Microsoft Corporation. All rights reserved.

CommandLine: C:\Test\MapiTest\Debug\MapiTest.exe
Symbol search path is: SRV*C:\WINDOWS\Symbols*http://msdl.microsoft.com/download/symbols
Executable search path is:
ModLoad: 00400000 0041f000   MapiTest.exe
ModLoad: 7c900000 7c9b2000   ntdll.dll
ModLoad: 7c800000 7c8f6000   C:\WINDOWS\system32\kernel32.dll
ModLoad: 61e00000 61e1f000   C:\WINDOWS\system32\MAPI32.dll
ModLoad: 77dd0000 77e6b000   C:\WINDOWS\system32\ADVAPI32.dll
ModLoad: 77e70000 77f02000   C:\WINDOWS\system32\RPCRT4.dll
ModLoad: 77fe0000 77ff1000   C:\WINDOWS\system32\Secur32.dll
ModLoad: 7e410000 7e4a1000   C:\WINDOWS\system32\USER32.dll
ModLoad: 77f10000 77f59000   C:\WINDOWS\system32\GDI32.dll
ModLoad: 774e0000 7761d000   C:\WINDOWS\system32\ole32.dll
ModLoad: 77c10000 77c68000   C:\WINDOWS\system32\msvcrt.dll
ModLoad: 77120000 771ab000   C:\WINDOWS\system32\OLEAUT32.dll
ModLoad: 10480000 10537000   C:\WINDOWS\system32\MSVCP100D.dll
ModLoad: 10200000 10372000   C:\WINDOWS\system32\MSVCR100D.dll
(a98.864): Break instruction exception - code 80000003 (first chance)
eax=00251eb4 ebx=7ffdf000 ecx=00000003 edx=00000008 esi=00251f48 edi=00251eb4
eip=7c90120e esp=0012fb20 ebp=0012fc94 iopl=0         nv up ei pl nz na po nc
cs=001b  ss=0023  ds=0023  es=0023  fs=003b  gs=0000             efl=00000202
ntdll!DbgBreakPoint:
7c90120e cc              int     3
0:000> !htrace -enable
Handle tracing enabled.
Handle tracing information snapshot successfully taken.
0:000> g
ModLoad: 76390000 763ad000   C:\WINDOWS\system32\IMM32.DLL
ModLoad: 3fde0000 40221000   C:\WINDOWS\system32\MSI.DLL
ModLoad: 35f70000 360bd000   C:\Program Files\Common Files\SYSTEM\MSMAPI\1033\MSMAPI32.DLL
ModLoad: 74720000 7476c000   C:\WINDOWS\system32\MSCTF.dll
ModLoad: 3fde0000 40221000   C:\WINDOWS\system32\msi.dll
ModLoad: 35e80000 35f40000   C:\Program Files\Common Files\SYSTEM\MSMAPI\1033\MAPIR.DLL
ModLoad: 773d0000 774d3000   C:\WINDOWS\WinSxS\x86_Microsoft.Windows.Common-Controls_6595b64144ccf1df_6.0.2600.5512_x-ww_35d4ce83\Comctl32.dll
ModLoad: 77f60000 77fd6000   C:\WINDOWS\system32\SHLWAPI.dll
ModLoad: 77c00000 77c08000   C:\WINDOWS\system32\version.dll
ModLoad: 755c0000 755ee000   C:\WINDOWS\system32\msctfime.ime
(a98.ac): Break instruction exception - code 80000003 (first chance)
eax=7ffdf000 ebx=00000001 ecx=00000002 edx=00000003 esi=00000004 edi=00000005
eip=7c90120e esp=00a4ffcc ebp=00a4fff4 iopl=0         nv up ei pl zr na pe nc
cs=001b  ss=0023  ds=0023  es=0023  fs=0038  gs=0000             efl=00000246
ntdll!DbgBreakPoint:
7c90120e cc              int     3
Missing image name, possible paged-out or corrupt data.
0:001> !htrace -snapshot
Handle tracing information snapshot successfully taken.
0:001> g
ModLoad: 3fde0000 40221000   C:\WINDOWS\system32\msi.dll
ModLoad: 35e80000 35f40000   C:\Program Files\Common Files\SYSTEM\MSMAPI\1033\MAPIR.DLL
(a98.c08): Break instruction exception - code 80000003 (first chance)
eax=7ffdf000 ebx=00000001 ecx=00000002 edx=00000003 esi=00000004 edi=00000005
eip=7c90120e esp=00a4ffcc ebp=00a4fff4 iopl=0         nv up ei pl zr na pe nc
cs=001b  ss=0023  ds=0023  es=0023  fs=0038  gs=0000             efl=00000246
ntdll!DbgBreakPoint:
7c90120e cc              int     3
Missing image name, possible paged-out or corrupt data.
Missing image name, possible paged-out or corrupt data.
0:001> !htrace -diff
Handle tracing information snapshot successfully taken.
0xdd new stack traces since the previous snapshot.
Ignoring handles that were already closed...
Outstanding handles opened since the previous snapshot:
--------------------------------------
Handle = 0x000001bc - OPEN
Thread ID = 0x00000d9c, Process ID = 0x00000a98

0x7c80ea2b: kernel32!CreateMutexA+0x00000065
*** ERROR: Symbol file could not be found.  Defaulted to export symbols for C:\Program Files\Common Files\SYSTEM\MSMAPI\1033\MSMAPI32.DLL -
0x35f74552: MSMAPI32!SzGPrev+0x000002b6
0x35f74476: MSMAPI32!SzGPrev+0x000001da
0x35f76c46: MSMAPI32!FOpenThreadImpersonationToken+0x00000fb9
0x35f76bc9: MSMAPI32!FOpenThreadImpersonationToken+0x00000f3c
0x35f76ba3: MSMAPI32!FOpenThreadImpersonationToken+0x00000f16
0x35f7662e: MSMAPI32!FOpenThreadImpersonationToken+0x000009a1
--------------------------------------
Handle = 0x000001c4 - OPEN
Thread ID = 0x00000d9c, Process ID = 0x00000a98

0x7c80ea2b: kernel32!CreateMutexA+0x00000065
0x35f7452f: MSMAPI32!SzGPrev+0x00000293
0x35f74476: MSMAPI32!SzGPrev+0x000001da
0x35f76c46: MSMAPI32!FOpenThreadImpersonationToken+0x00000fb9
0x35f76bc9: MSMAPI32!FOpenThreadImpersonationToken+0x00000f3c
0x35f76ba3: MSMAPI32!FOpenThreadImpersonationToken+0x00000f16
0x35f7662e: MSMAPI32!FOpenThreadImpersonationToken+0x000009a1
--------------------------------------
Handle = 0x000001cc - OPEN
Thread ID = 0x00000d9c, Process ID = 0x00000a98

0x7c80955f: kernel32!CreateFileMappingA+0x0000006e
0x35f744d4: MSMAPI32!SzGPrev+0x00000238
0x35f74476: MSMAPI32!SzGPrev+0x000001da
0x35f76c46: MSMAPI32!FOpenThreadImpersonationToken+0x00000fb9
0x35f76bc9: MSMAPI32!FOpenThreadImpersonationToken+0x00000f3c
0x35f76ba3: MSMAPI32!FOpenThreadImpersonationToken+0x00000f16
0x35f7662e: MSMAPI32!FOpenThreadImpersonationToken+0x000009a1
--------------------------------------
Displayed 0x3 stack traces for outstanding handles opened since the previous snapshot.
Well, there they are “0x3 stack traces for outstanding handles” all coming solidly from within MSMAPI32.dll. Now that we know who’s responsible for the allocations, let’s see if it’s any of our settings that is causing this. In other words, is there some flag that we can use or remove that might fix this issue?
Fortunately, there are only 3 flags that can be set in MAPIINIT_0. Since MAPI_NT_SERVICE is absolutely necessary, we are left with only two others: MAPI_NO_COINIT and MAPI_MULTITHREAD_NOTIFICATIONS. Trying the combinations of these flags, in addition to the default when MAPIINIT_0 is not set, unfortunately, doesn’t do away with the leak.
Another important fact is that I was using an old MAPI provider. Since we support Outlook 2003 as the minimum version for a MAPI provider, that’s what I was using. I had no service packs installed. The relevant DLLs and their respective version numbers that resulted in the aforementioned behavior are the following:
- MSMAPI32.dll – 11.0.5601.0
- MSO.dll – 11.0.5606.0
- MSPST32.dll – 11.0.5604.0
Conclusion
Tracking memory leaks can be painful, but with the help of the right tools it could be very organized and rewarding. With the help of windbg we easily tracked the memory leak to the source, which turned out to be the MAPI DLL. Unfortunately, the only thing we might be able to do is to avoid calling MAPIInitialize more than once per process. Another is to upgrade the MAPI DLL, with the hope that Microsoft has fixed these issues. But until then, our clients would appreciate if we had found workarounds. Understanding and pinpointing the problem gives the developers the edge necessary to devise a workaround for our customers. And a workaround we implemented.
Update (April 02, 2011):
While trying to figure out workarounds of this issue, I ran into The Intentional Memory Leak by Stephen Griffin, the author of MfcMapi. Apparently, they left the leak in because some ancient applications (going back to the early 1990’s) were accessing freed memory. To avoid penalizing bad code, it was decided to make everyone else pay the price in leaks. This solution isn’t new or specific to MAPI, many other cases exist on OS level as well as other platforms. Still, it doesn’t fail to frustrate.


